
Too many homes or too few?
More than enough
3.7%of rental homes sit empty
Sources: CMHC 2025 Rental Market Report, City of Vancouver CMHC memo
RENT PULSE, WEEKLY REPORT
THIS WEEK'S EXAMPLES
Cheapest 1 bedroom
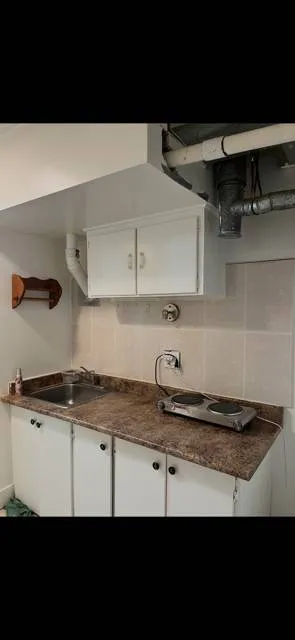 $1,000
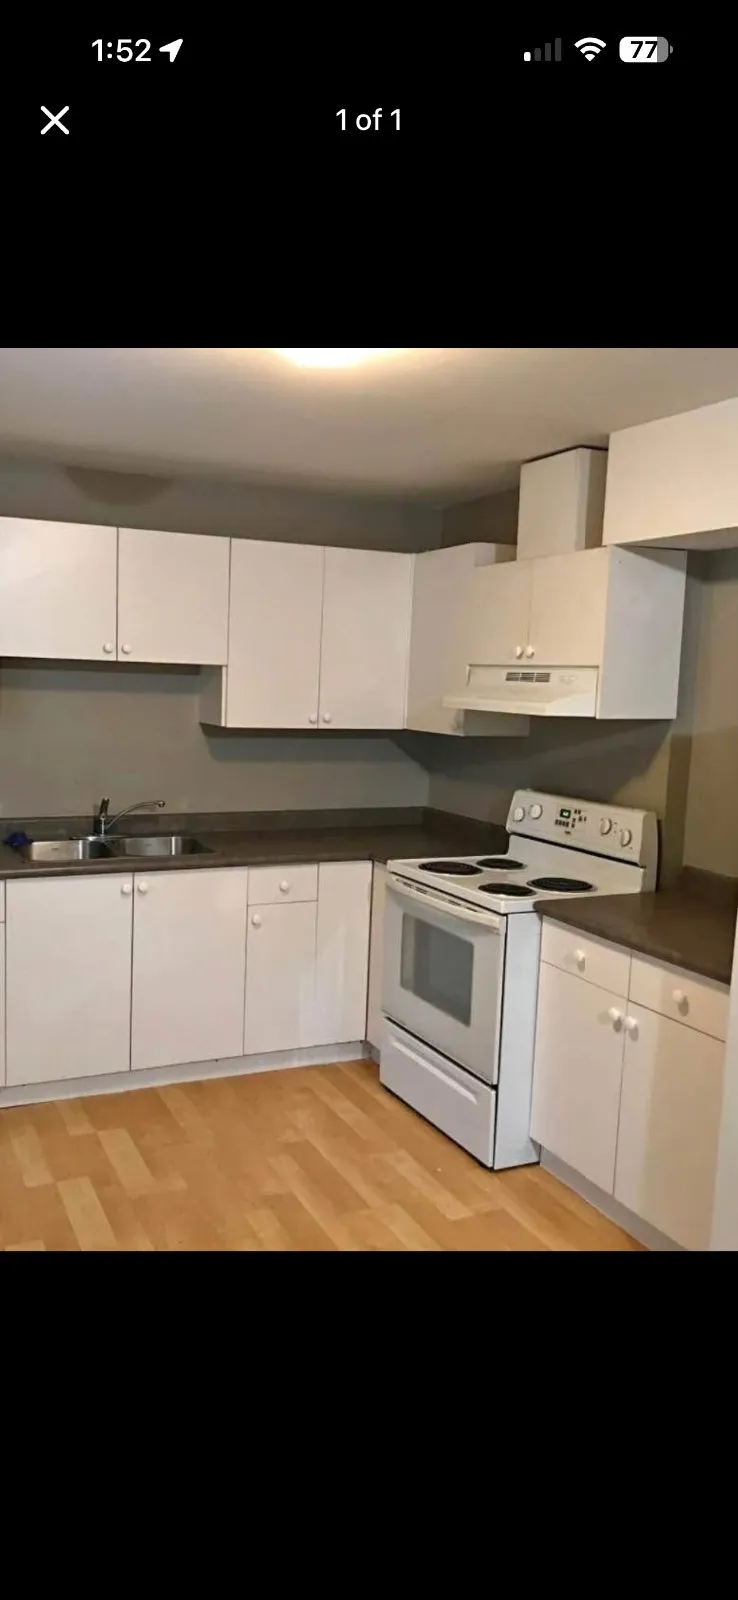 $1,000
Priciest 1 bedroom
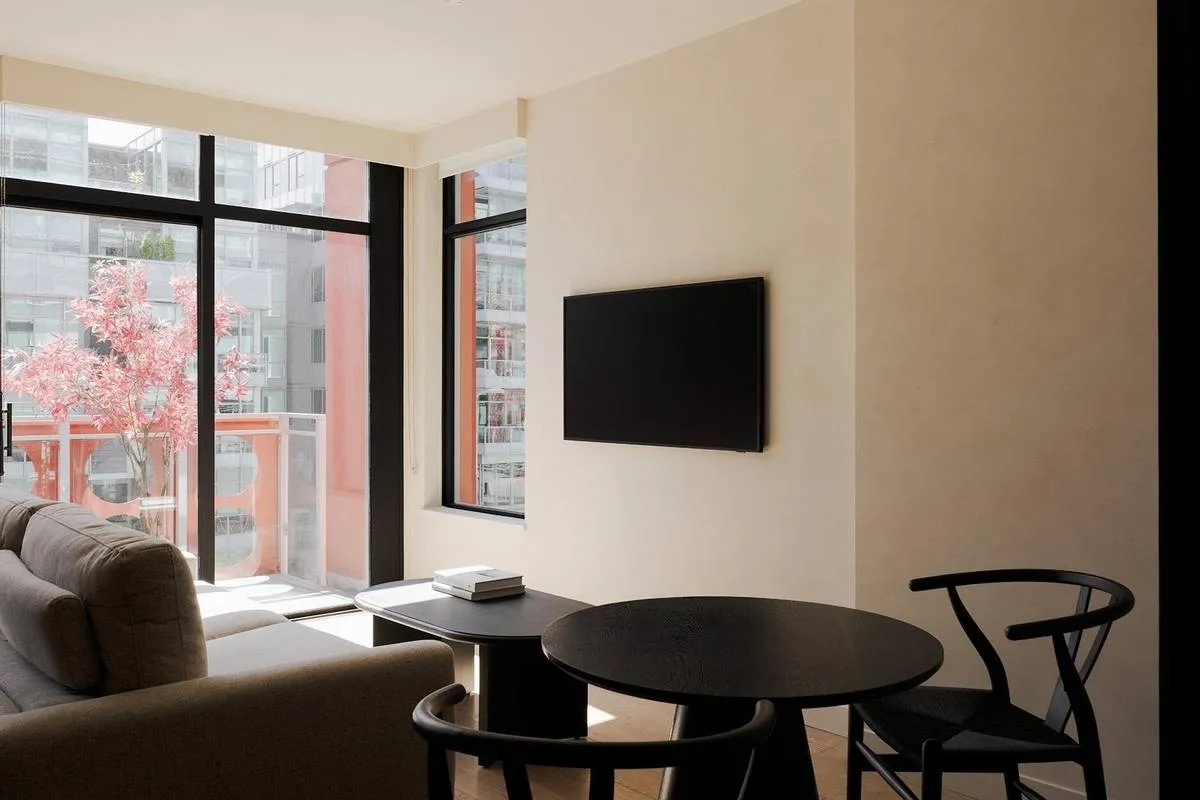 $4,000
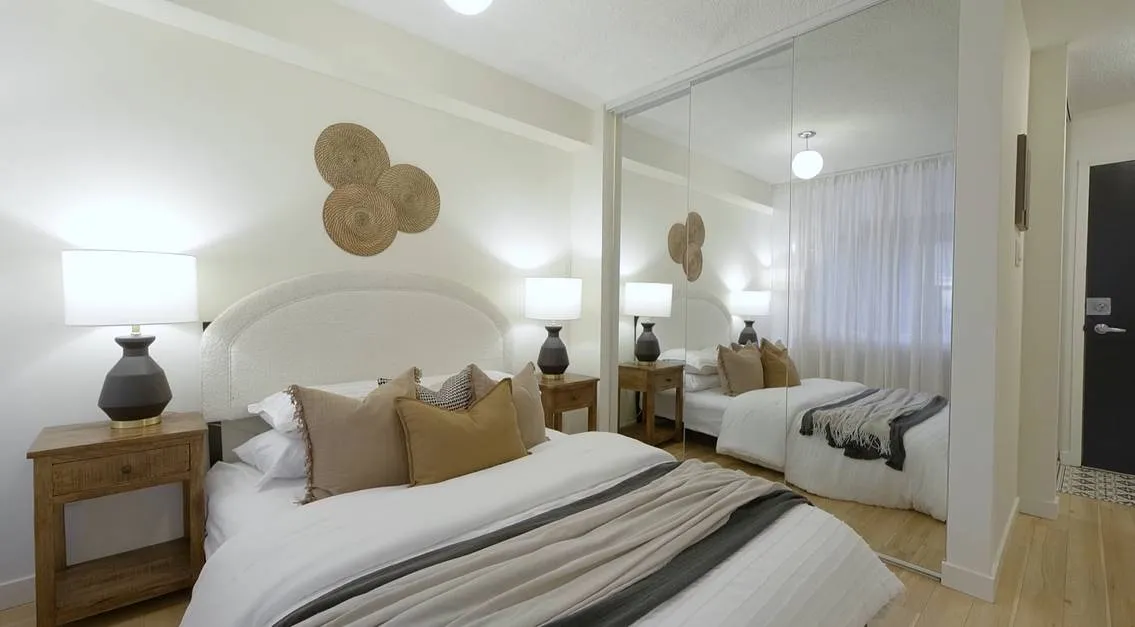 $4,000
 $3,945
Very low prices can be scams or rooms listed as units. Never pay before you see the home.
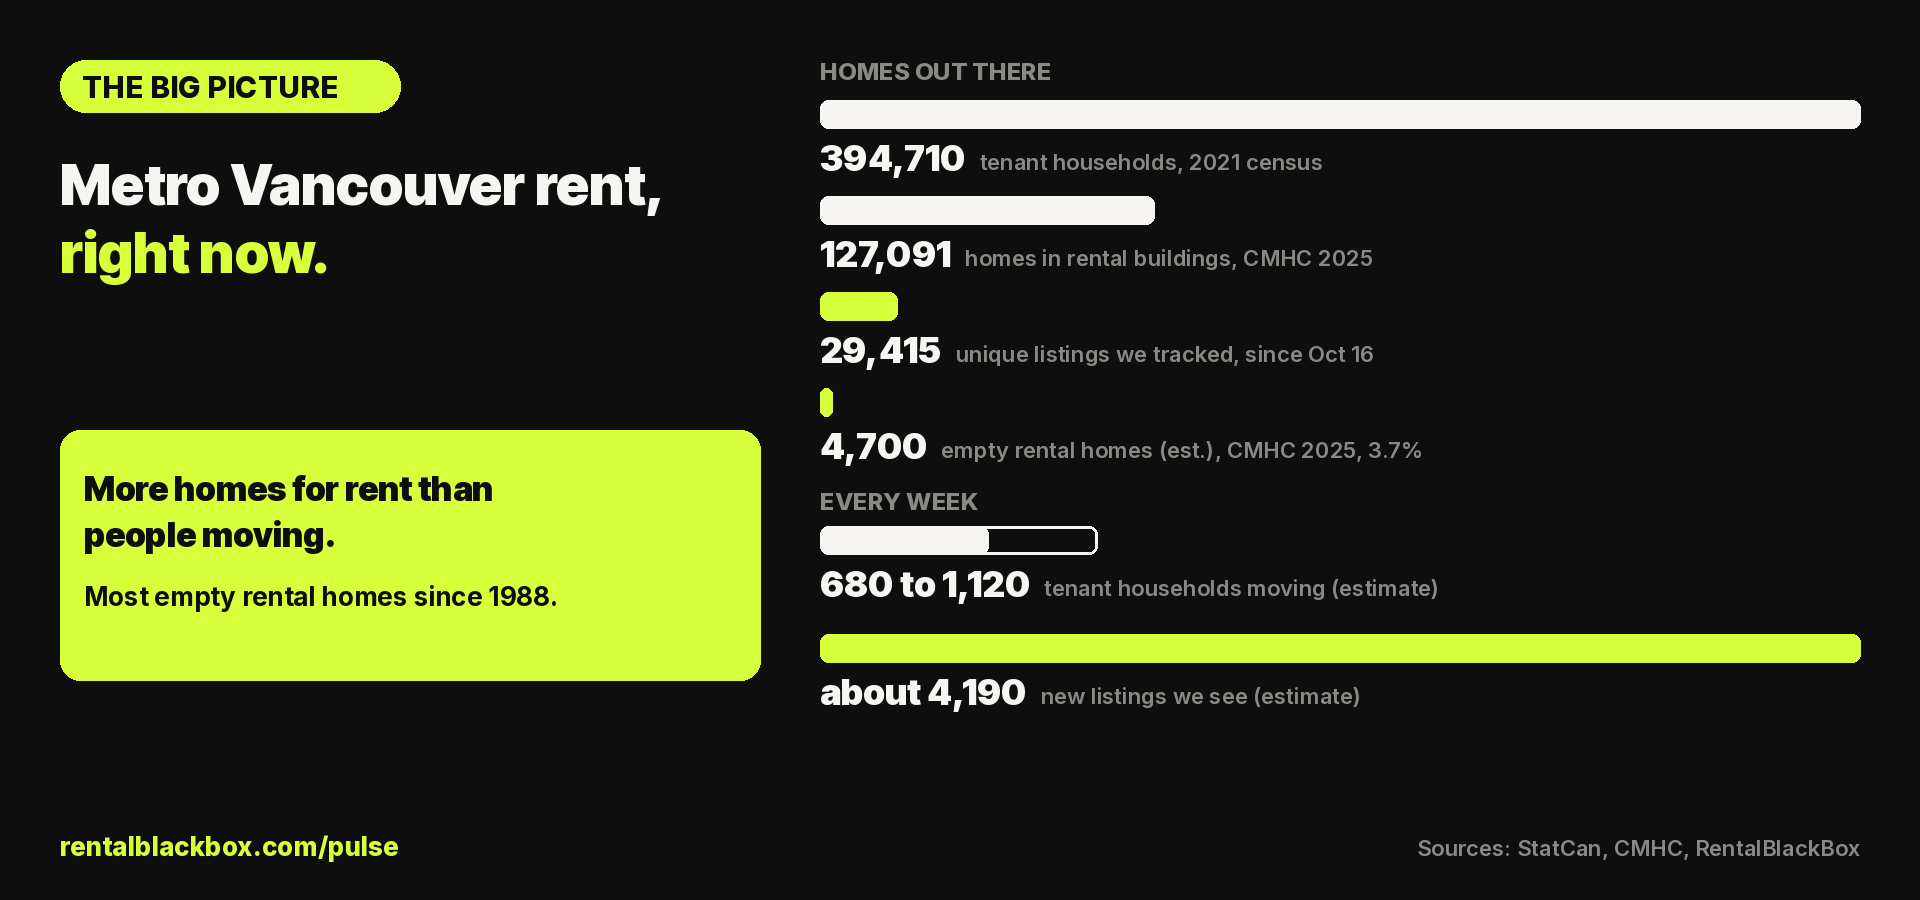
THE BIG PICTURE
THE BIG PICTURE
Metro Vancouver rent,
right now.
More homes for rent than people moving.
Most empty rental homes since 1988.
HOMES OUT THERE
394,710 tenant households, 2021 census
127,091 homes in rental buildings, CMHC 2025
29,415 unique listings we tracked, since Oct 16
4,700 empty rental homes (est.), CMHC 2025, 3.7%
EVERY WEEK
680 to 1,120 tenant households moving (estimate)
about 4,190 new listings we see (estimate)
rentalblackbox.com/pulse Sources: StatCan, CMHC, RentalBlackBox
Too many homes or too few?
More than enough
3.7%of rental homes sit empty
Sources: CMHC 2025 Rental Market Report, City of Vancouver CMHC memo
Who needs a home?
Hundreds move each week
9% to 15% move a year
680 to 1,120moves a weekSource: StatCan 2021 census
What we see
Thousands of new ads a week
about 4,190new listings a week
Why so many empty homes?
Demand slowed, supply grew
Sources: StatCan 2025 population estimates, Metro Vancouver forecast, CMHC 2025 Rental Market Report, BC rule, about 10%
When listings rise or fall
Summer peak, winter low
A new building can also add many ads at once.
Source: Rentals.ca
WHAT OUR DATA CAN AND CANNOT TELL
Can
Cannot
For landlords: North Vancouver listings came down fastest this week, a median of 8 days. Price there with confidence.
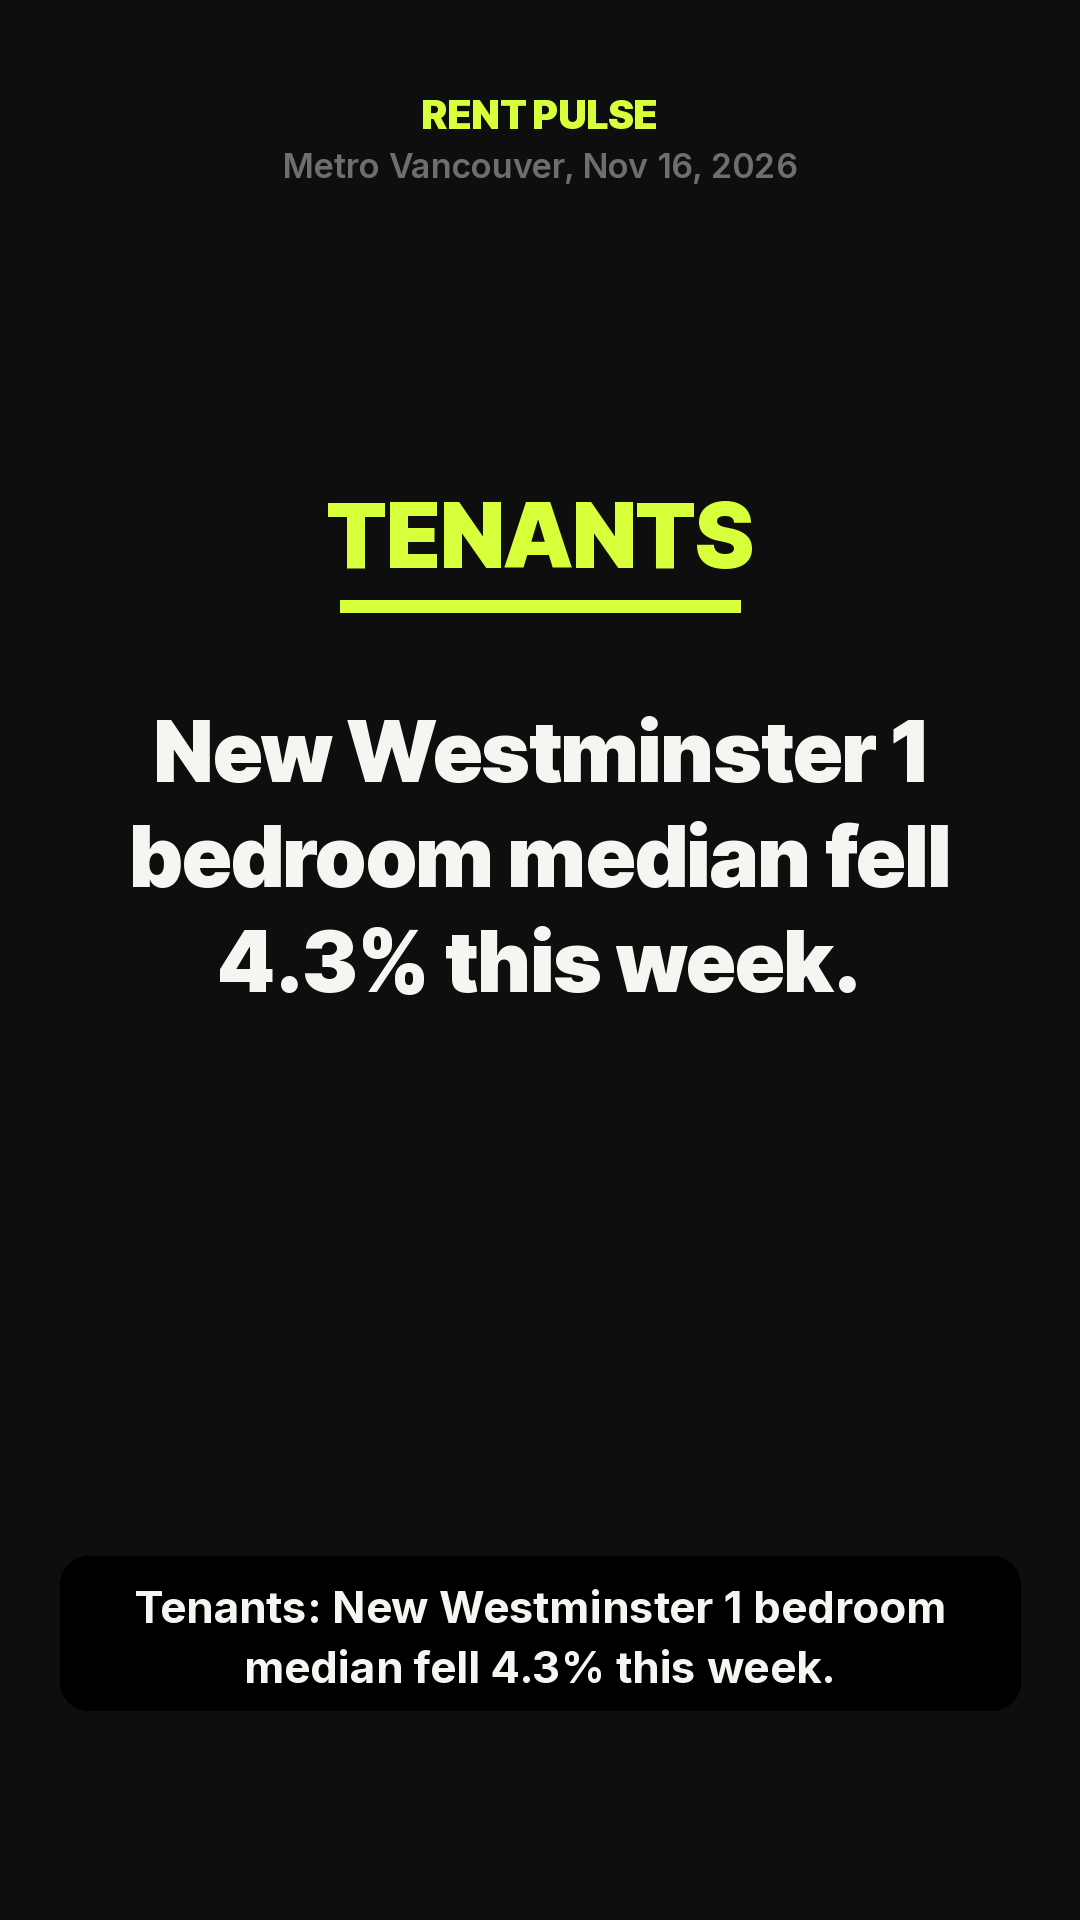
For tenants: New Westminster 1 bedroom median fell 4.3% this week. Ask for a lower rent there. 21.5% of active listings have cut their price, by a median of 4.9%. It is fair to ask for less.
MEDIAN RENT BY AREA
| City | 1 bedroom | 2 bedroom |
|---|---|---|
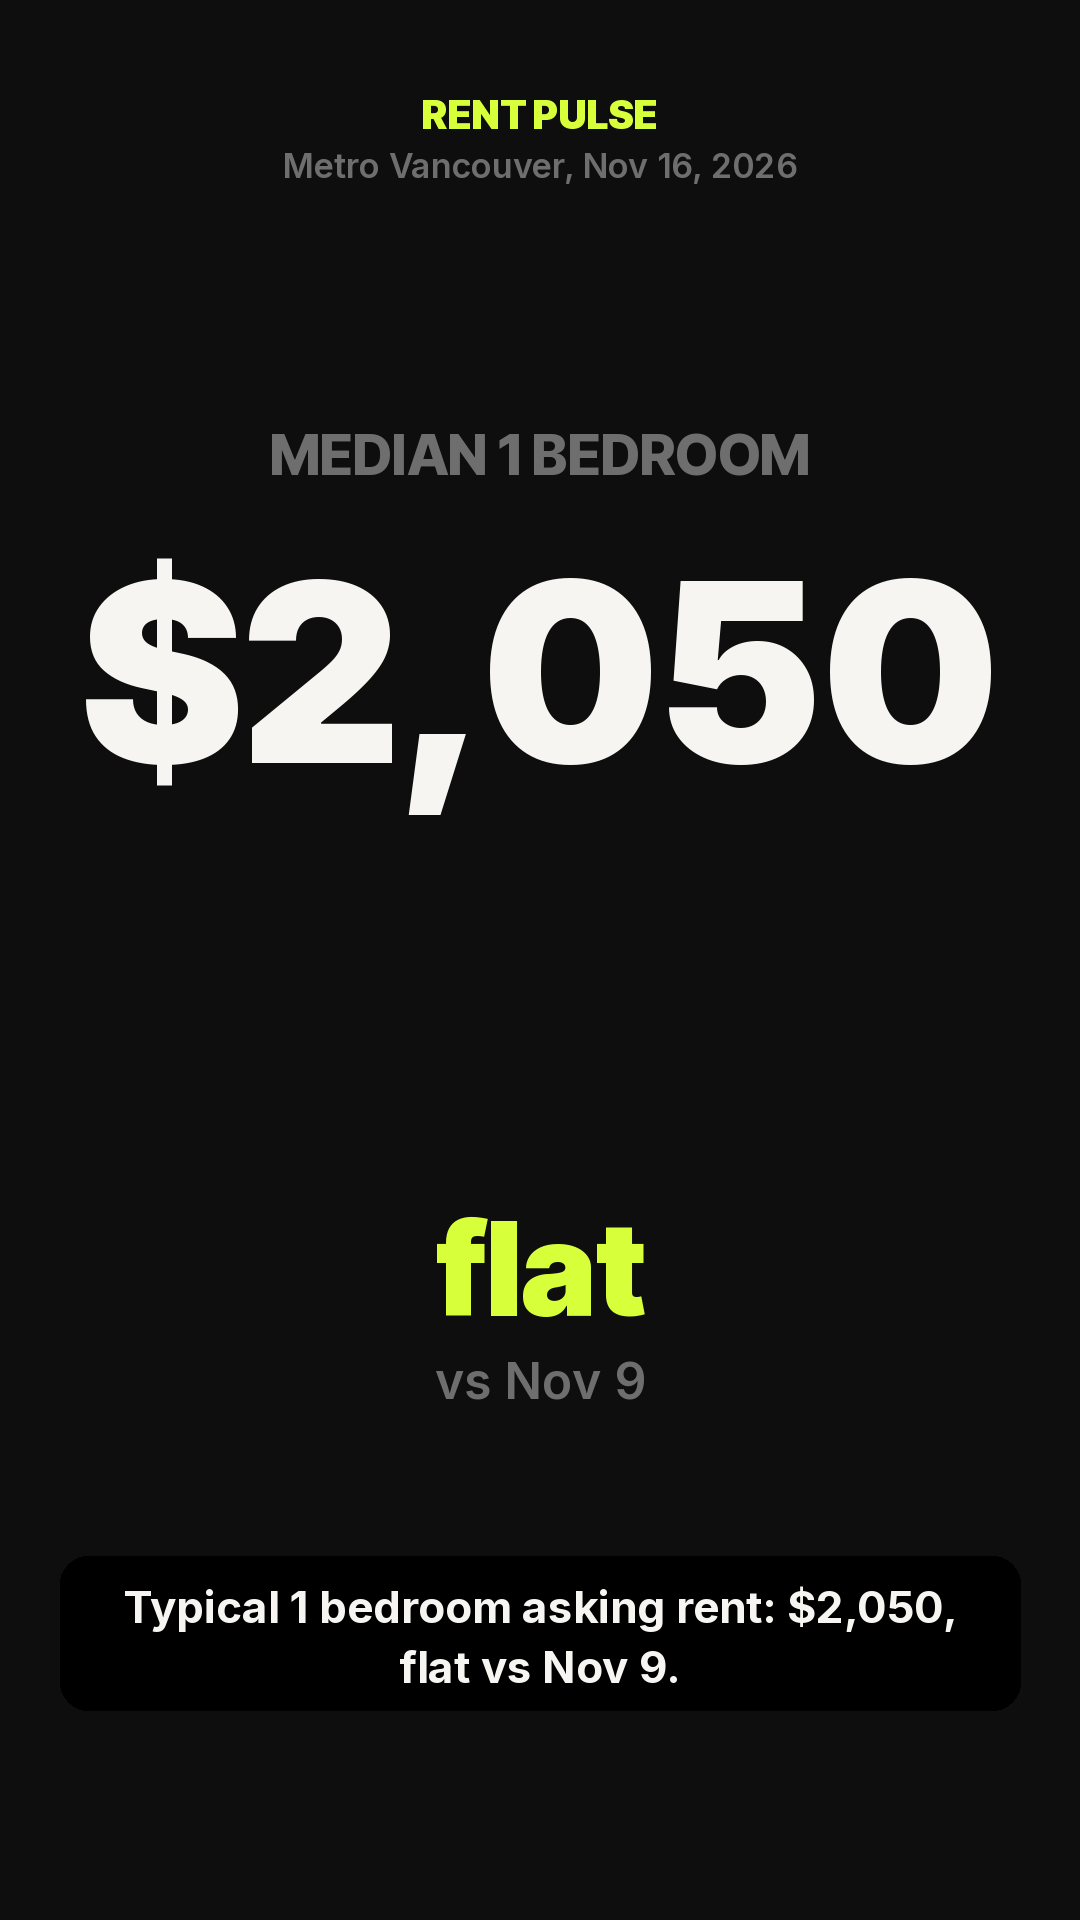
| Vancouver | $2,300 | $2,990 |
| Burnaby | $1,997 | $2,500 |
| Surrey | $1,600 | $1,900 |
| Richmond | $1,950 | $2,650 |
| North Vancouver | $2,300 | $2,995 |
| Coquitlam | $1,900 | $2,250 |
| New Westminster | $1,800 | $2,450 |
Daily median asking rent of listings live that day.
DAYS TO RENT
1,089 listings disappeared this week. Median time online: 15 days.
| City | Median days | Listings |
|---|---|---|
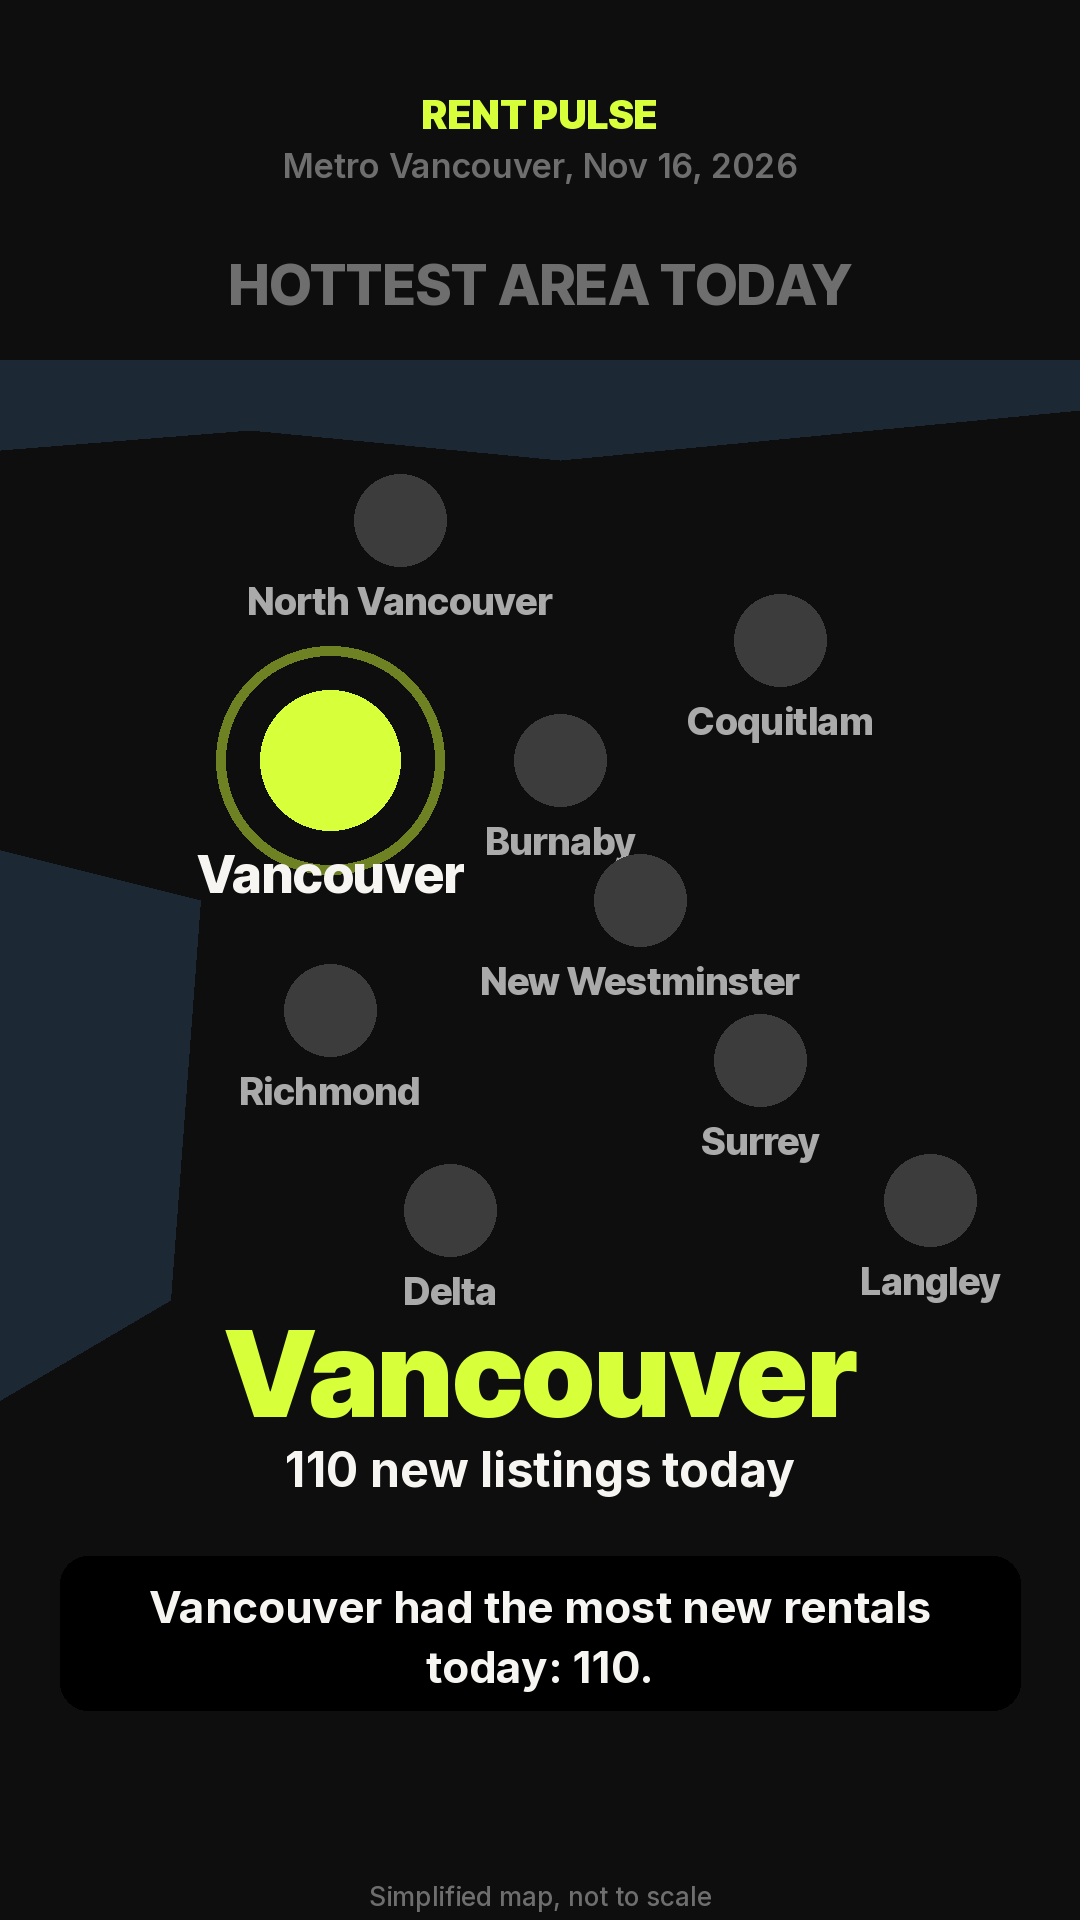
| North Vancouver | 8 | 80 |
| Surrey | 11 | 86 |
| Vancouver | 11 | 471 |
| Coquitlam | 17.5 | 46 |
| Richmond | 19 | 51 |
| Burnaby | 23 | 230 |
PRICE DROPS
2,635 of 12,231 active listings now ask less than when we first saw them, by a median of 4.9%.
REPEAT UNITS
324 units with a unit number were listed more than once; 129 came back at a different rent. This sample is still very small, so read it as a first signal only. It grows every week.
ABOUT THESE NUMBERS
These are asking rents from public listings on Craigslist, Kijiji, liv.rent and RentFaster, not signed leases. We started tracking on Oct 16, 2026, so the history is short and days to rent cannot be longer than the days we have watched. A listing that disappears may be rented, or the landlord may have taken it down. Groups with fewer than 10 listings are hidden. How we measure.
PAST REPORTS
Nov 16 to Nov 22Nov 9 to Nov 15Nov 2 to Nov 8Oct 26 to Nov 1Oct 19 to Oct 25Oct 12 to Oct 18